Bea Goller

Sonic Spaces

Researches related on the intersection between architecture, sound, space and form


+ Info

Bea Goller

PhD Architect is also a founder member of Sonic Space Research lab.
Since 2008 she has been researching about the relationship between
sound and architecture (vibration and morphology) and finding interesting
connections between science, art and technology.
She received her PhD, titled Sonic Spaces from the ETSAM in 2015.


image


Sonic Spaces Research Lab

Researches related on the intersection between sound, space and form
#Sonifications #DataTranslations #Creative Programming #Immersivity

Sound is one of other sensorial layers under explored in architecture due to the predominance of the visual.


more

Now, translating data processes offer suggestive potentials integrating sonorous layer in design processes. While sensory layers are implicit in creative architectural design processes, sound phenomena is a particularly relevant one. Given the close relationship between sound, space and form, the configuration of a sonorous dimension might enhance customary architecture as focus on space. Translations between data, sound, forms and design in the digital domain, are still quite unrevealed. Such processes can convert sound into a motor of formal genesis, opening up new design paradigms.

The Sonic space research lab deals about the crossing between morphological form and sonic vibrations through data translation. This process interprets data by converting digital entities into others. The most popular of these processes are sonifications and data visualizations. All these kind of techniques are usually made through specific coding, connecting these practices with the digital craftmanship. The digital domain offers many possibilities in creativity, hybridizing different knowledge fields with multiple sequences, variations and unexpected results. Specific experiments of data translation are shown, opening up design possibilities and creative techniques. Some of these experiments are produced by means of 3D printing. The goal of this research is to show how the sound can generate forms and the forms can be heard, establishing relationships between sound and space. Passing from shape to sound and from to sound creates an indicating loop about art being a continuous transformation and that things can have more than one appearance.
Bea Goller

Sonic Spaces Research Lab

Experiments


:// Sonic Hypercube
2018

Sonic Hypercube is an immersive and physical game instrument to play around with electronic music.
It borrows the Math concept of a Hypercube, a 4D Dimensional Cube that somehow is a cube inside a cube in a 4D Space.
As a kind of physical audio game, the algorithmic instrument is structured in 4 levels of dimensions where we can create
first a Tap Tempo Beat with synth percussions (dim 1 : Beats). Secondly a baseline to play around with pentatonic pitches (dim 2 : Baseline)
Followed by different kind of digital instruments ( dim 3: drones, riffs and polyrhythms) that are mixing with the previous generated loops.
Finally, the dim 4 is related to the sound movement through the quadraphonic system.

+ info at beagoller.net/hypercube image


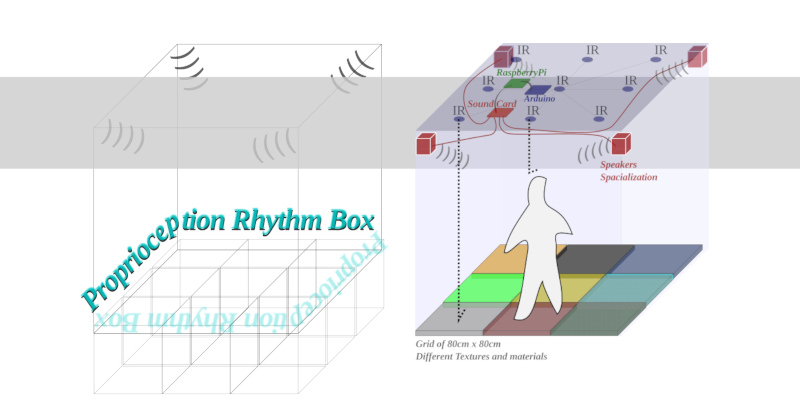
:// Paisatges Aurals Proprioception Rhythm Box
2017

An experimental installation where proprioception* sense is explored
*from Latin proprius ['one's own], and capio [to take or grasp],
is the sense of the relative position of one's own parts of the body
and strength of effort being employed in movement.

+ info at beagoller.net/aurals image


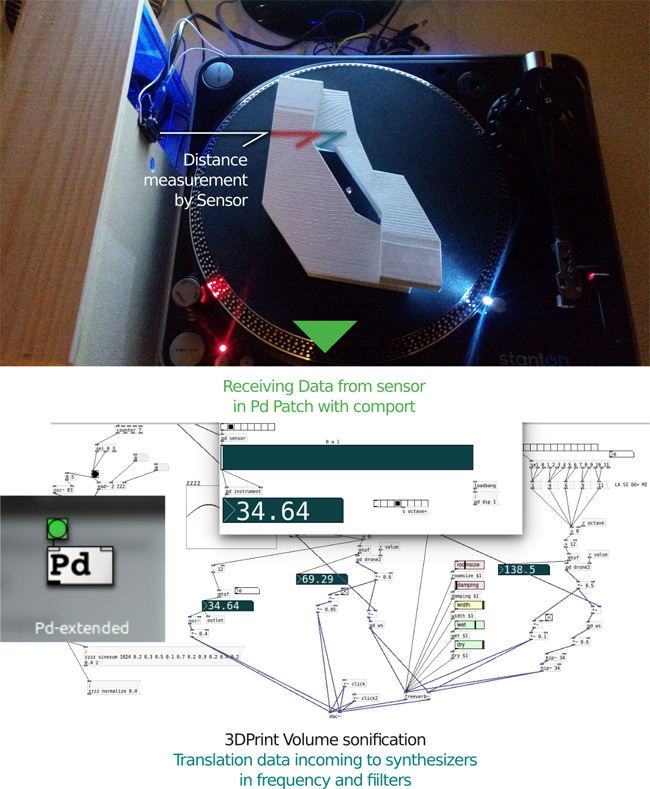
:// Form Sonifier Turntable
2015

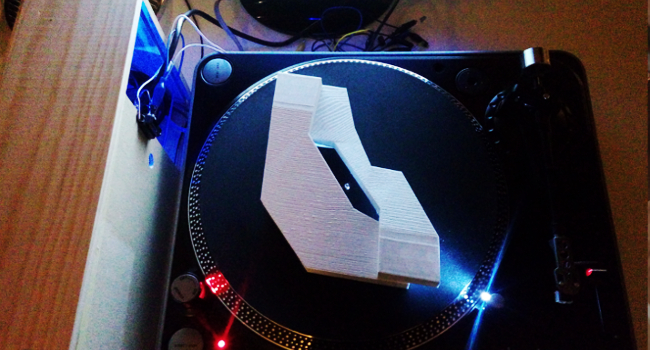
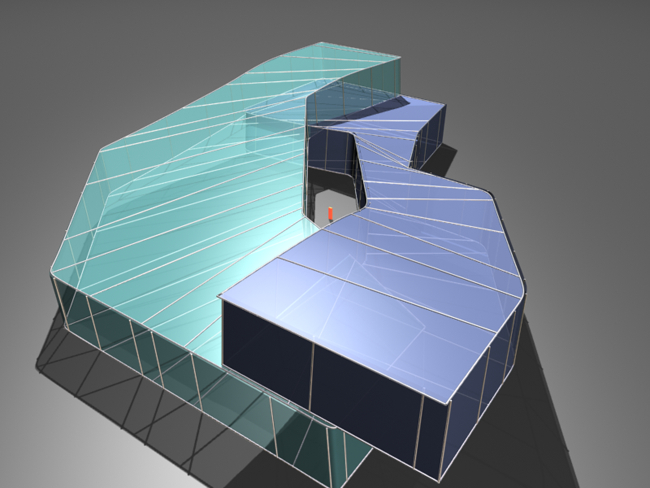
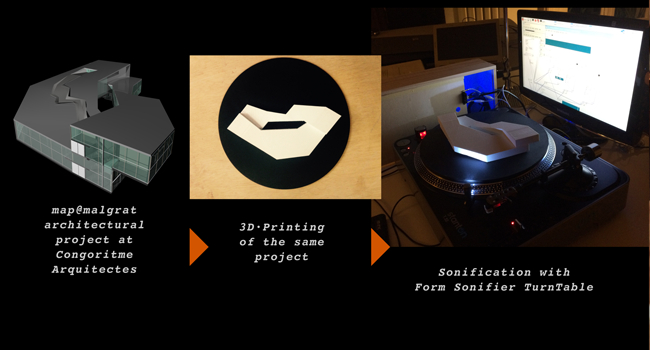
Sonification device of m@pmalgrat's 3DPrinted Model Project of Congoritme Architects

more

Sonification experiment of the building m@pmalgrat.etc For this experiment we have chosen the design of a civic center building in Malgrat we did for a competition, due to the generation process and the resulting form. Firstly, there has been an impression 3D of the rendered model. This architectural sculpture has been placed on a turntable. Sonifying this project is another way to understand it, because architecture is shown with sound. The Möebius form connotes fluidity and connects well with the concept of electronic music loop. Like the use of a turntable plate is already referring to the world of sound. This sonification experiment is based on the distance measurement when the building is spinning constantly. Like a LP, the model turns around on a player disc and produces a sound. Here the DJ deck acts like when we go around the building’s exterior. Instead of a needle capturing a sound in the grooves of the LP, there is a sensor that detects the position of the building and sends the signal to an Arduino. The sensor converts the analog signal into digital and sends it to RaspberryPi (microcomputing). An application programmed with Pure Data finally produces this sonification.

+ info at sonomorphism wordpress blog
image image image image


:// Sonification of MIES Pavillion materials
2015

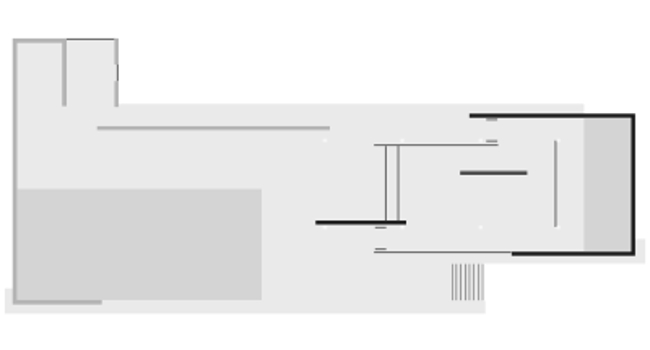
Sonification first stage experiment of materials in the Mies van der Rohe's Barcelona Pavillion

more

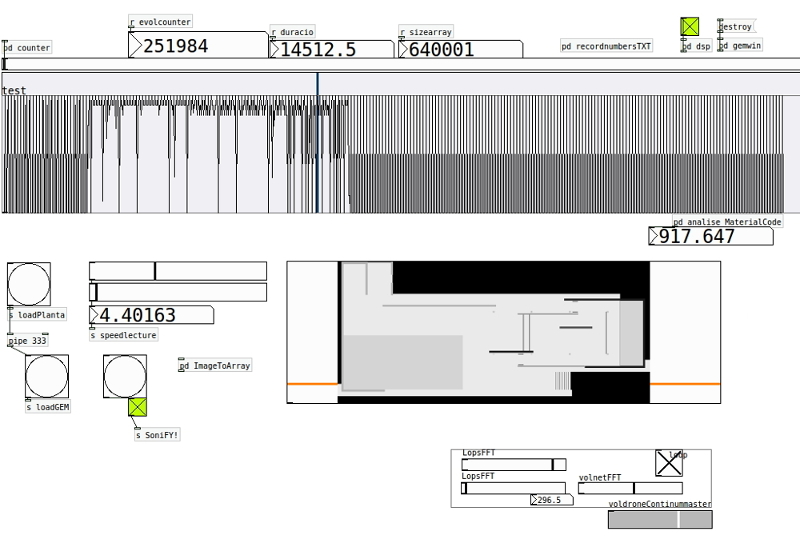
The German Pavilion by Mies van der Rohe represents a landmark of modern architecture. Its floor plan layout is simple with few building materials: travertine, onyx, glass and steel pillars, plus two water surfaces and a sculpture. This experiment is a first attempt to become aware of an emblematic building in Barcelona by sound. It is an attempt to give another artistic experience to the perception of it. Listening to it rather than seeing it can open new paths of understanding. Through sounds it can be detected if there is a structural order or not, if there is repetition, the time between one material and another matching the space, etc. If you hear two identical sounds, one after another, you will understand that the elements are very near. If they are far apart in time, you will imagine that they are spatially separated as well. The attentive listening is something that we're not normally accustomed to. We have based our culture for many centuries upon the visual. It's time we open our perception to other senses, in this case the sound. To present the building through a sound perception means that we can extend our understanding of architectural visionaries. It is another way to enjoy architecture. This sonification also intends to give a contribution towards blind people to experience the Mies pavilion. Like a scanner, which recognizes each pixel of the picture on the ground, we hear a sound, which shows that there is a wall of marble, glass, stainless steel or water. The pavilion’s sonification has been done with the programming language Pure Data. Numerical values ​​of each construction element of the pavilion floorplan have been taken in relation to the chromatic scale drawing. Then these numbers have been adjusted to sound frequencies that relate in a way to the construction materials themselves. That is, when the scanner reaches a glass wall, the sound you hear is more acute than when it passes along travertine walls. Different materials of the pavilion have been taken from the grayscale values. Then this drawing has been entered to the program Pure Data as an array of RGB values that detects and converts them into frequencies. The reading of the scanner that reproduces the sounds of materials has been from left to right and from top to bottom.
image image


:// Indeterminacy Data Translations [3DPrinted Experiment result]
2015

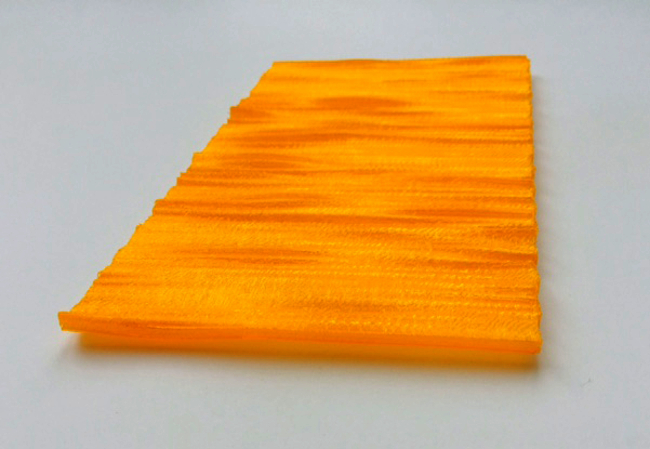
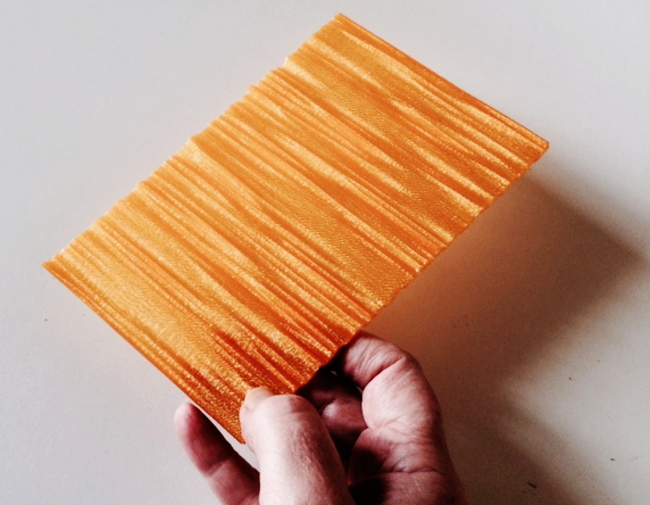
"This 3D Printed surface was originally a 5 sentences text"
image image image


:// ARTICLE : Sound as Space Generator
2014

Sound as Space Generator / Bea Goller image


:// Indeterminacy Data Translations PROCESS
2014

Experiment of Data Translation
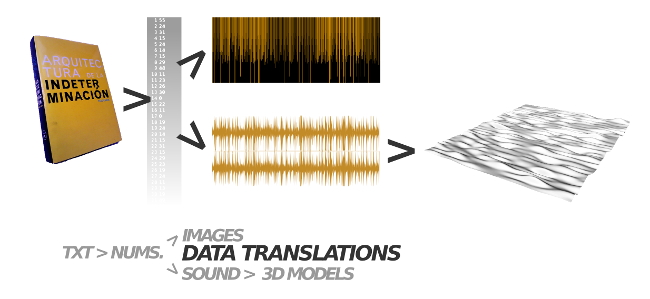
From Text to Images, From images to Sound, From Sound to 3DForms

more

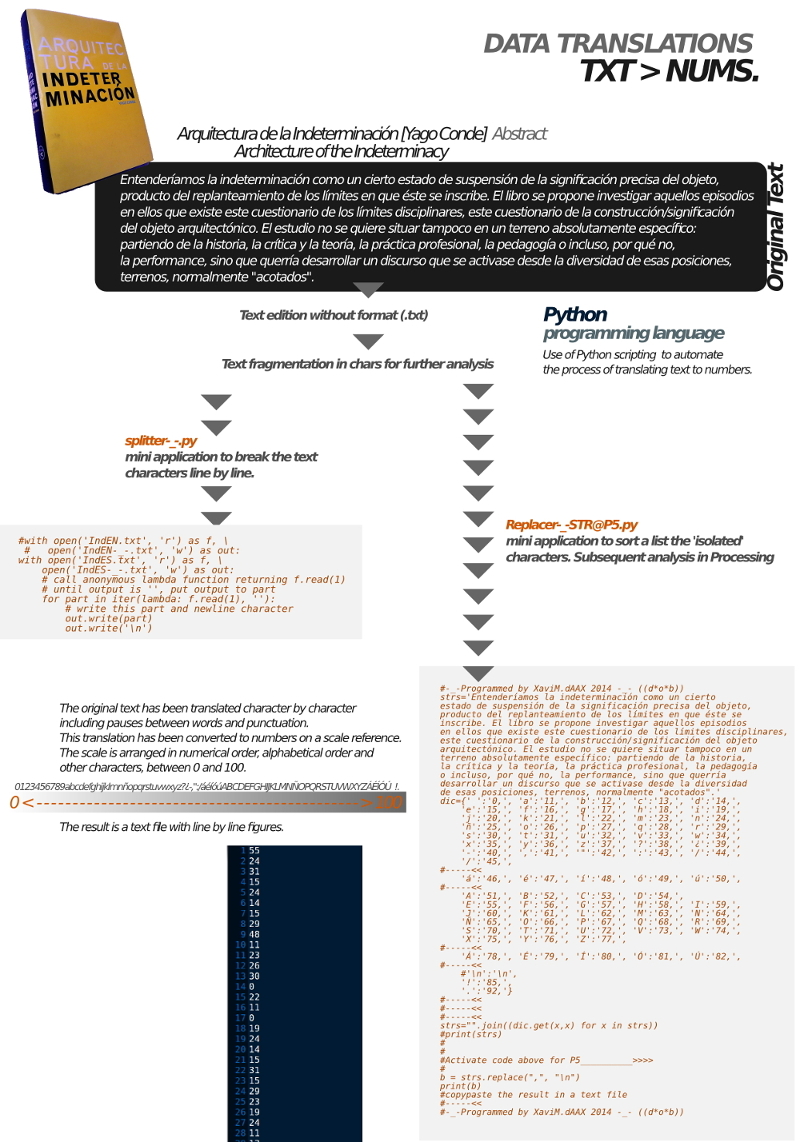
Experiment of Data Translation The bases of the experiment Data Translation is the formal analysis of a text, the Book excerpt Architecture indeterminacy by Yago Conde. It is an analysis of the shape of the text through the letters or characters of the same. The text has been translated literally into a series of numerical values, character by character.

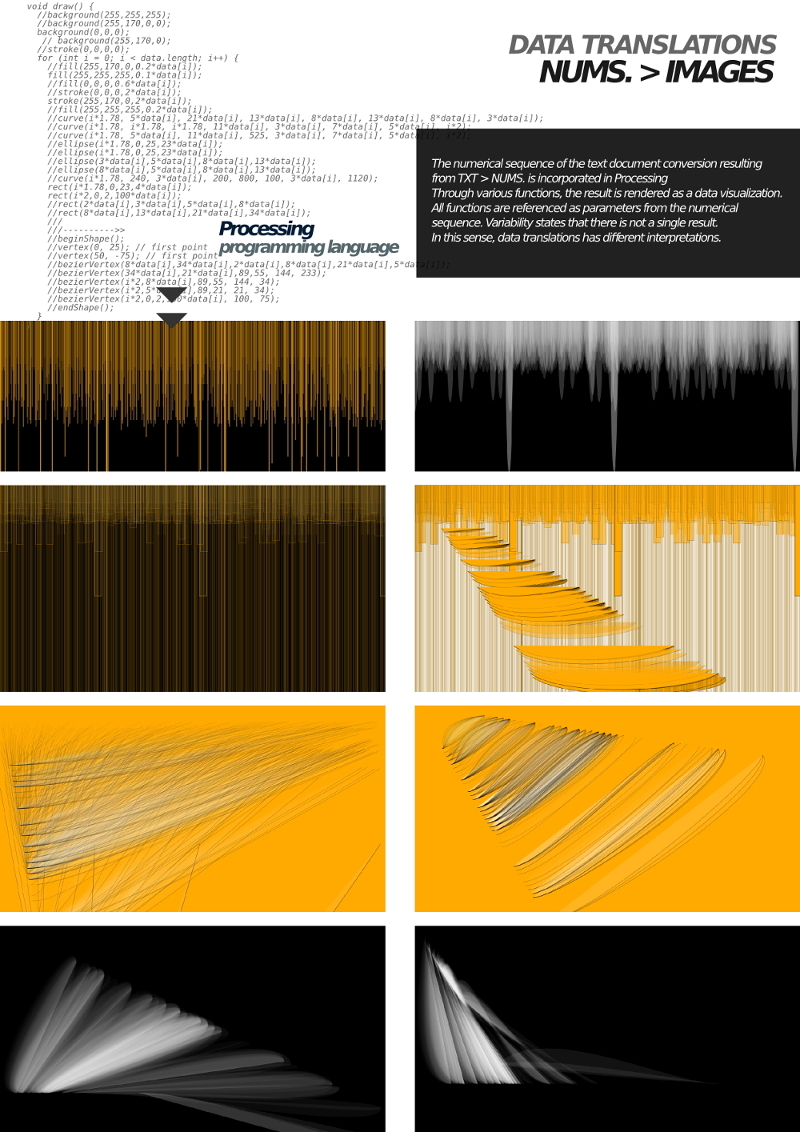
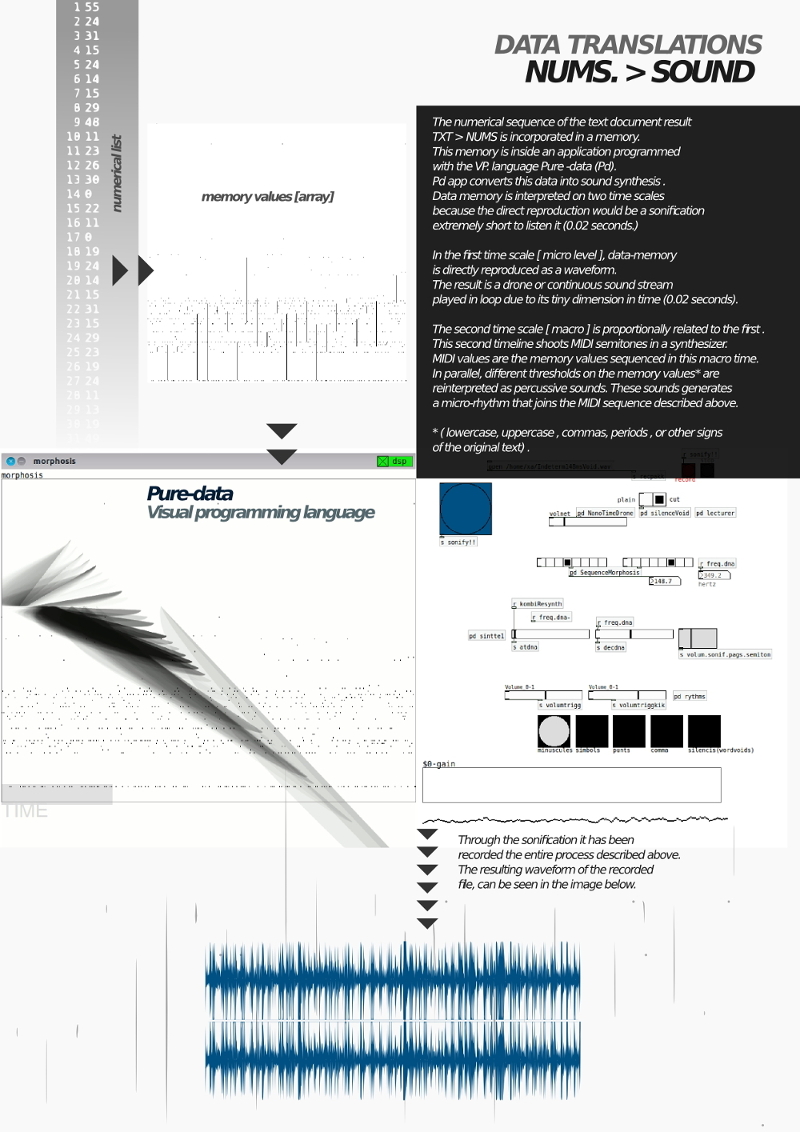
On one hand, this numerical sequence allows the conversion using some digital tools into data visualization and on the other into a sonification. For the data visualization the numerical sequence of the text document conversion resulting from the text to numbers is incorporated in Processing. Through various functions, the result is rendered as data visualization. All functions are referenced as parameters from the numerical sequence. Variability states that there is not a single result. In this sense, data translation has different interpretations. For the sonification the numerical sequence of the text document is incorporated in a memory. This memory is inside an application programmed with the language Pure Data (PD). PD app converts this data into sound synthesis. This sound is recorded and introduced as input in the soundplot software. This software converts again sound samples into three dimensional forms. The waveforms of the samples are reinterpreted by functions, These functions are rendered on models as surfaces, curves or dot matrix. The parameters used in functions can lead to a wide formal variability although they all come from the same source. Then the forms get 3Dprinted.

+ info at sonomorphism wordpress blog
Tech Steps and documentation at Audiyolab
image image image image


:// Cordes
2012

CØRDES
Experiment with Golden Ratio applied to sound and form

more

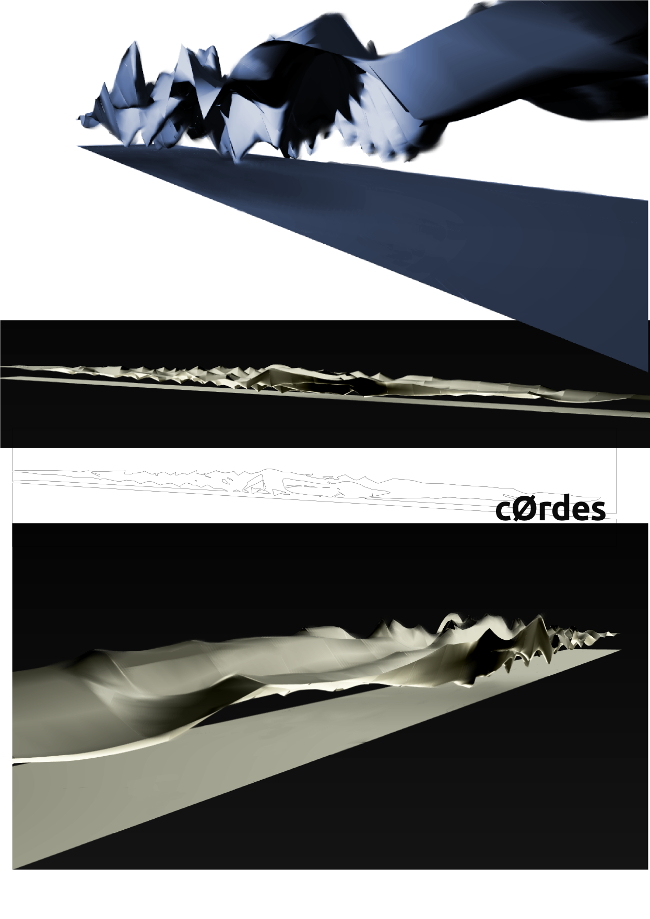
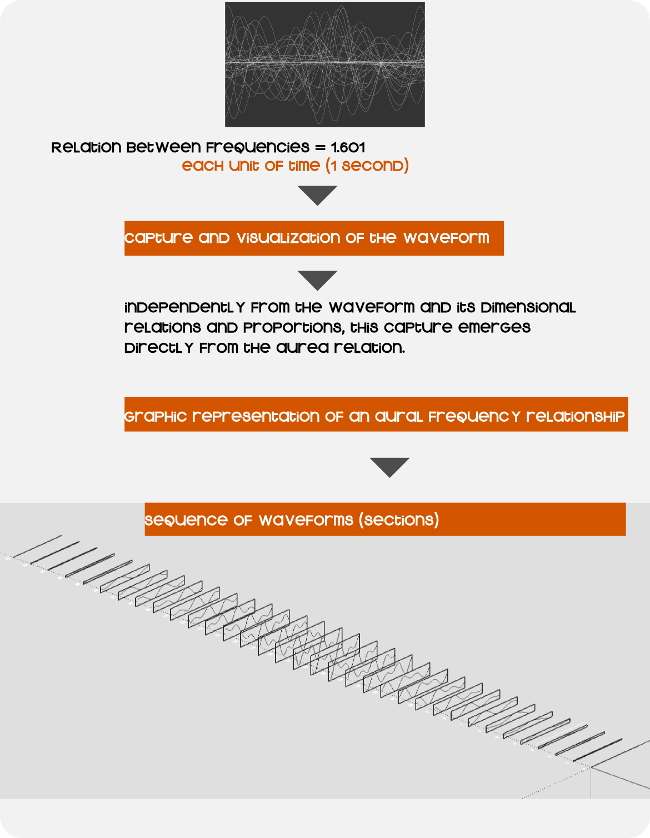
Cordes experiment attempts to find a harmonious relationship from sound frequencies and transfer it into a three-dimensional space model. The time factor is included as an implicit layer in this process. Usually, architecture is designed with three spatial dimensions, but without considering the appearance of n-dimensions from the latest physical theories, nor the temporal dimension. Yet, the time factor itself is included in sound and music, because it is an essential element of its own existence. To perform this experiment, we proceed to interconnect the time domain of the sound field, and the three-dimensional architectural domain, articulating space and form. In turn most decisions are made by automatisms and other generative processes.
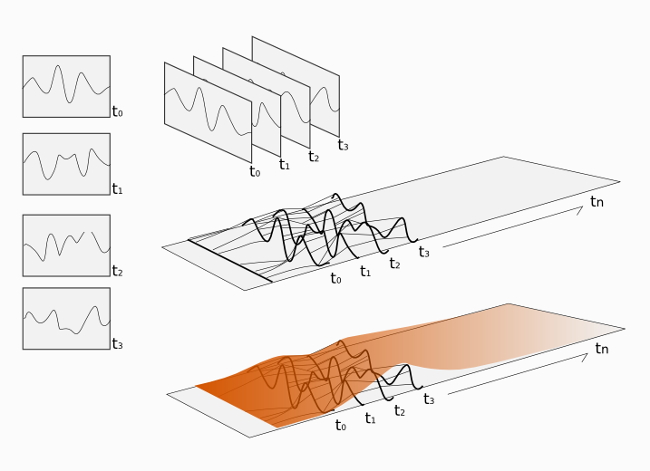
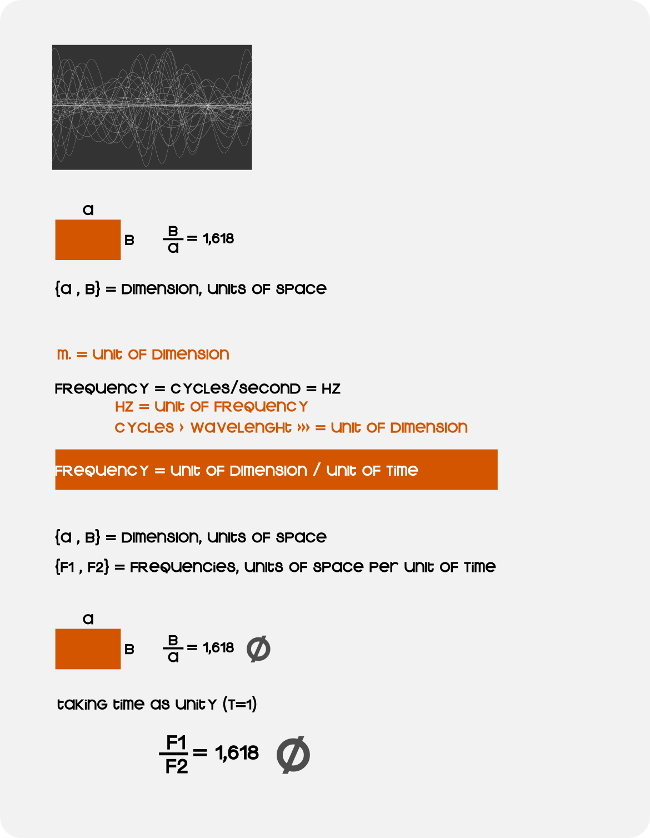
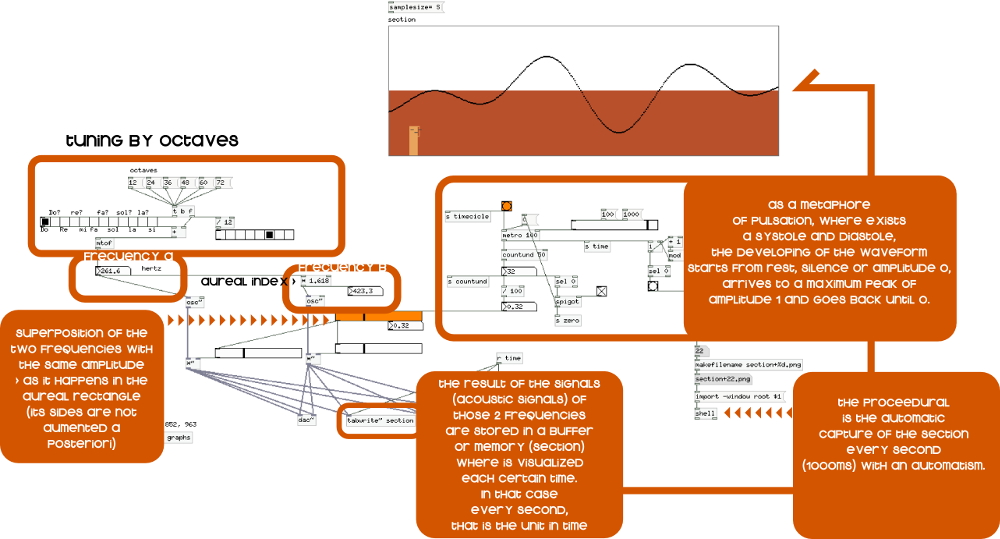
An analogy with frequencies F1 and F2 is constructed, by using the golden ratio as a paradigm of balanced proportion and establishing a relationship of Phi (i.e. F1 = F2 1.618). These frequencies are inherently sound units measured in cycles (Hertz). A Hertz is one cycle in unit time (1second). Thus this unit determines a spatial path (which will develop a 1 second cycle). Taking this unit of time as measure, it can be concluded that the relationship between F1 and F2 develops as a certain wavelength at a rate determined by a propagation medium. Ultimately, if the units of time and propagation velocity are constant, we establish that the relations between F1 and F2 correspond to relations in terms of wavelength, and therefore to a unit of dimensional measurement (meters or cm). In conclusion: wavelengths remain in the golden relationships. An application has been developed with the visual programming language Pure-data, to visualize the resulting waveform of the frequency ratio. Using a capture at a regular interval (it has been based on the time unit one second), taking the frozen waveform for each regular interval. These cuts in time are captured regardless a series of 34 cycles. The number of cycles in this sequence could have been varied. The number 34 is chosen because it belongs to the Fibonacci series, which is directly related to the golden ratio. Likewise, number 34 shows a sequence sufficient to model a route with certain size.
In this series we proceed to perform a sequence of progression, as a metaphor for a pulsation or vibrational motion. Ultimately, the course of the 34 catches corresponds to a greater pulse, sway, or systolic / diastolic movement. It starts from rest, can range up to values ​​of -1 and +1 and ends in the same initial state. The 34 catches are transformed into vectors, establishing them as sections of a formal and dimensional experiment 4. Once this operation is done, we proceed through 3d applications (Sketch-up and Rhino) to place them in equal distance sequence. Finally, when they are positioned as sections, a continuous surface between each of them is woven. The result can be seen in the illustration of Cordes.
This experiment may not determine whether the sections and resulting spaces become the golden ratio in absolute terms and strictly dimensional level. However, this is a test where the relationship is implicit in the formal generation. The process takes three-dimensionality with the move and sequence of these sections. This sequence is constantly articulated with fixed distances in time. Being a formal experiment, it might be reimagined as an architectural application with multiple solutions.
One possible solution is to settle a half buried space where the topological surface becomes a flat roof outside. In it, the underground vertical planes correspond to starting height and end of the piece. The virtual prism defined by previous planes intersects this surface and generates communication sockets and lighting. This is an experiment which has an expression close to a geological formation, connecting it to a landscape view. The most significant aspect is that all this comes exclusively from sound data in a temporal path equivalent to a pulsation. This is the minimum conceptual expression of a sound vibration. Another possible architectural application can be a large marquee, or even a skate park urban surface type. This experiment could have different applications in another scale. For example, it could be an element of street furniture.
We have to interpret sound and this can be done in many ways. Even though there is a mathematical relationship between frequencies (Hz) and the metric system, (due to the wave length), there are other ‘subjective’ considerations. These subjective intentions include: the stretching of the waveform’s screening, the dimensions used to articulate the sequence and the time of capturing the waveforms. However, as already mentioned in the preceding text, those parameters are taken as unity measures (one second between captures, one single oscillation to develop the whole form and unitary dimension as the length sections intervals). In conclusion, decisions follow the most possible conceptual path, because this is an abstract experiment, without specific size and program requirements. An important point of consideration is that the development of all the sequence as a generative process means that the ranges and limits are static, inside an unlimited state of variability. Generative processes are of a dynamic order, therefore departing from certain reference parameters, will have different and specific solutions.Usually these solutions can be considered as variations or combinations of a main root. Cordes is a formal experiment of data translation and sound. In other words, the sound synthesis becomes an engine of formal generation.

+ info at sonomorphism wordpress blog
image image image image image


:// Sonomorphism
2011

Soundmorphisms
From Sound to 3DForms

more

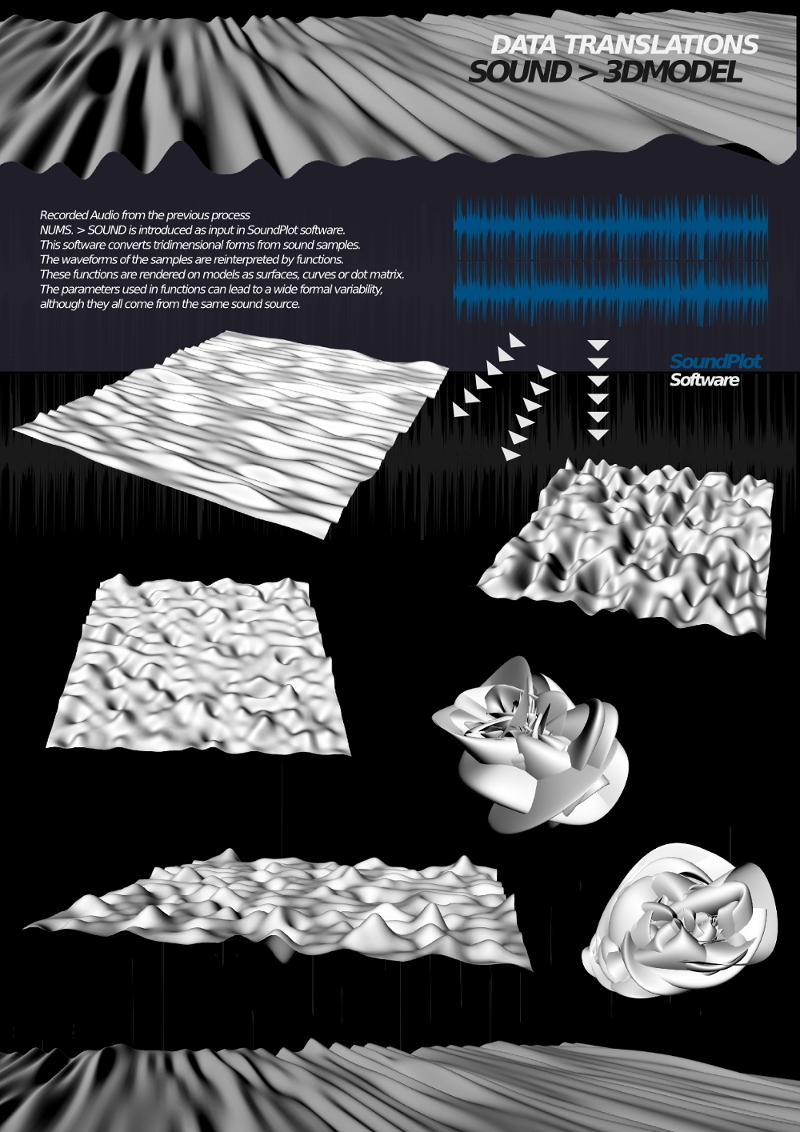
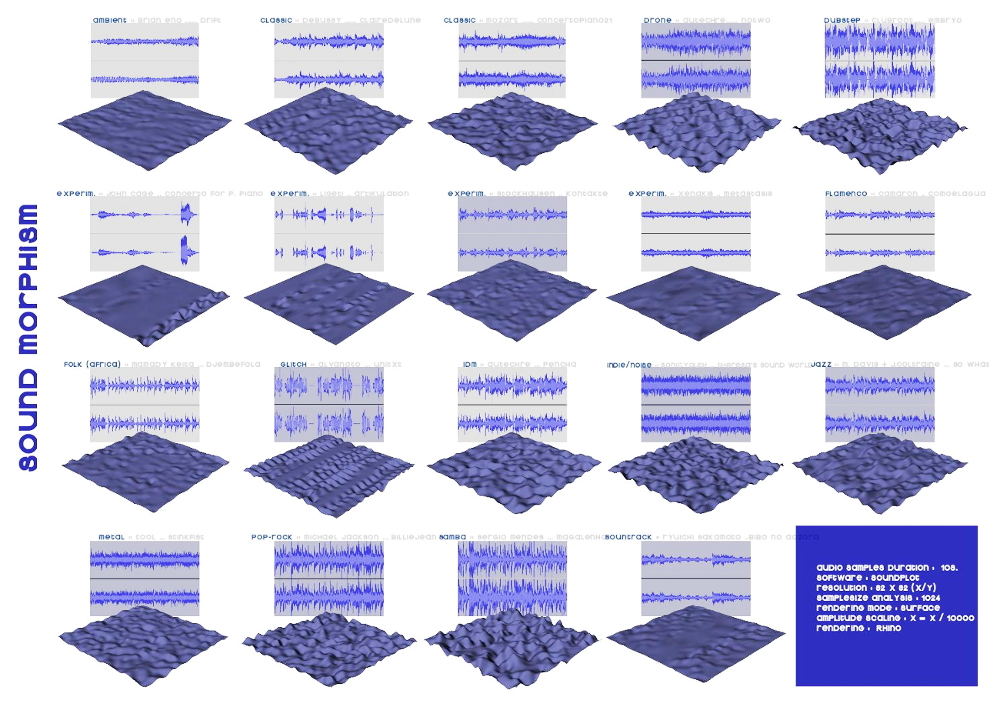
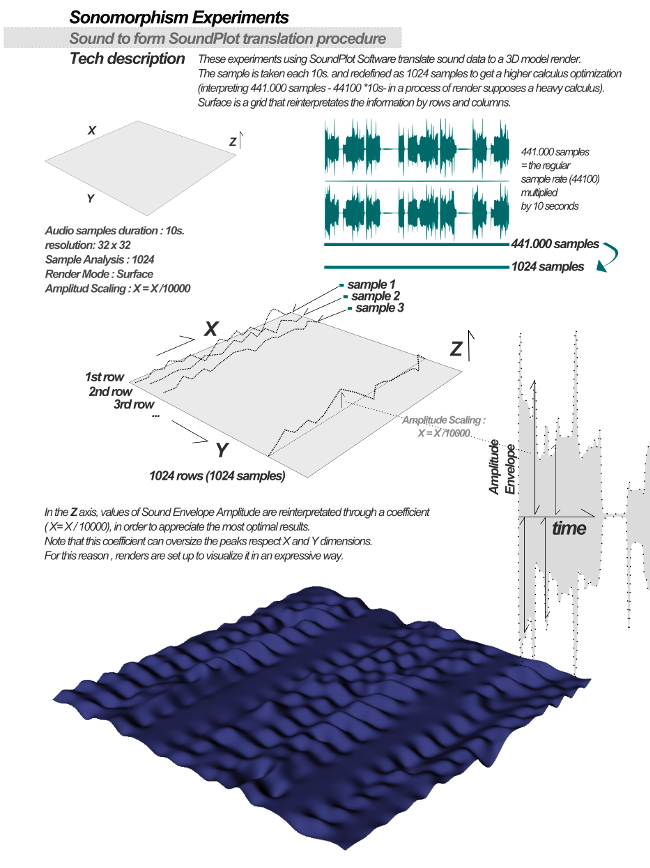
This experiment shows the translation of 19 sound samples into 3D models. The samples are of different types of music, form classical, flamenco, experimental, to techno music. The duration of the samples is 10 seconds. The software used is Soundplot, the resolution is always 32 x 32 (x/y), the sample size analysis is 1024, the rendering in Rhino is a surface and the amplitude scaling is x=x / 10000. What is interesting about the translation of data is that it increases relationships between information and matter. It also helps to understand quicker and sometimes better the structure, the pitch, the intensity, etc. of the sound.
The software SoundPlot allows translation of sound samples to three-dimensional maps, imported from different 3D CAD modeling software (eg. Rhino). The software interprets the different changes of value in a particular waveform. This is translated into various available geometric models (points, curves, poly lines and surfaces). This data interpretation of the waveform assigned to these geometric figures generates a three-dimensional map. The resulting model will have a volume depending on a mathematical function (logarithmic, exponential, etc.) that interprets the information for each simple waveform. The procedure and process by Soundplot has a fixed nature. For example, taking a fixed sound fragment, like an uncompressed audio file (.wav formats, or mp3) results as a 'frozen' map, available in different 3D CAD programs. Therefore it is a procedure in which the intrinsic time of any sound manifestation is analyzed, quantified and translated into the topology of a three-dimensional model. In synthetic terms, a fixed topological or frozen form is extracted from a sound sample fixed in time. The procedure is not real-time and requires rendering. The render can then become a sculpture with a 3D printer.

+ info at sonomorphism wordpress blog
image image


:// Cimatic Experiments
2011

Cymatic experiments
Ressonant patterns

more

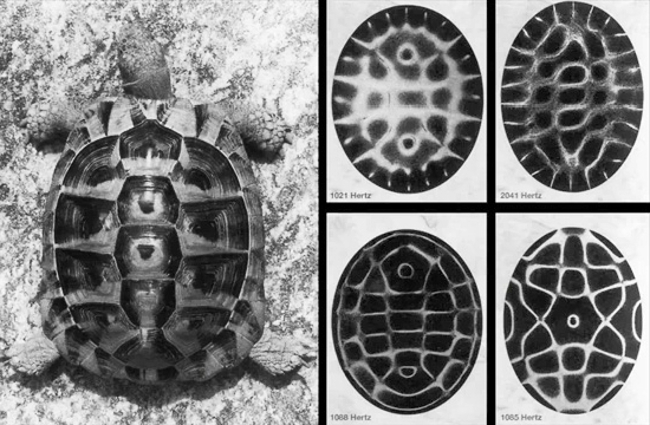
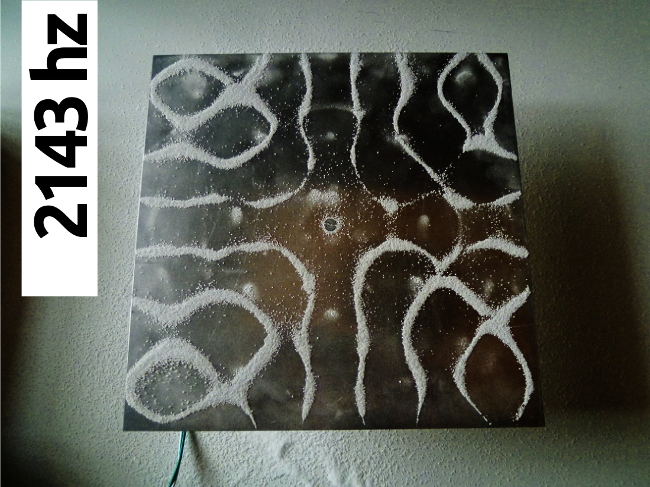
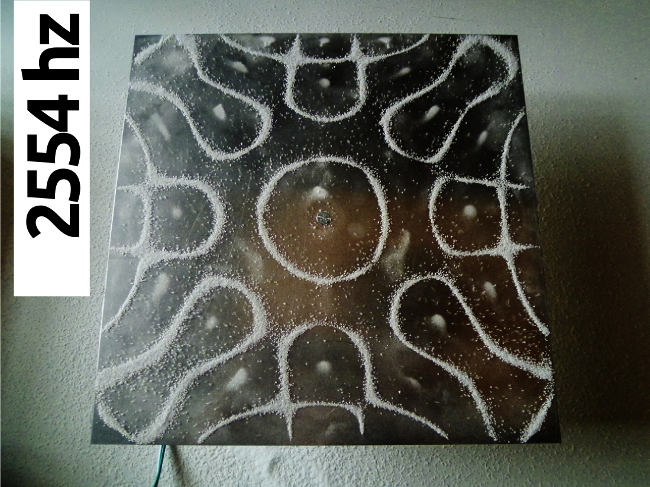
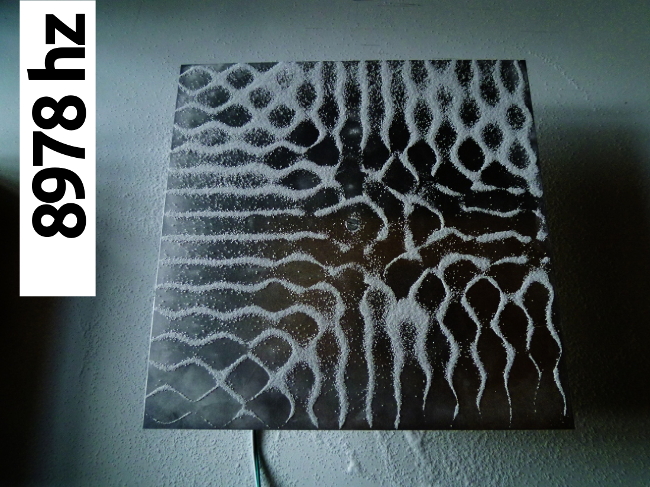
The science of cinematic visually demonstrates how the sound set the matter through resonant devices. These generate analog and material geometric patterns from certain frequencies manner. Cymatics is the study of the phenomenon of sound waves, and was discovered by the German physicist Ernst F. Chladni, who towards the end of the eighteenth century created patterns with sand by the vibration of a violin bow on a metal plate first. Later in the decade of the sixties of last century, the Swiss scientist Dr. Hans Jenny (1904-1972) studied this phenomenon more closely and was interested in the relationship matter and energy.
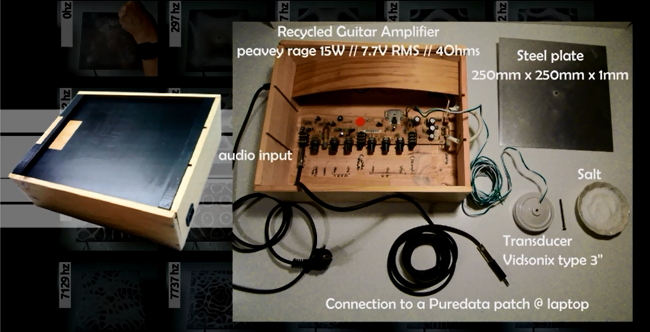
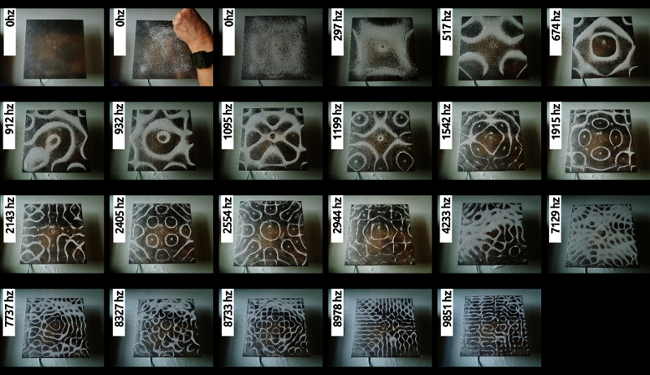
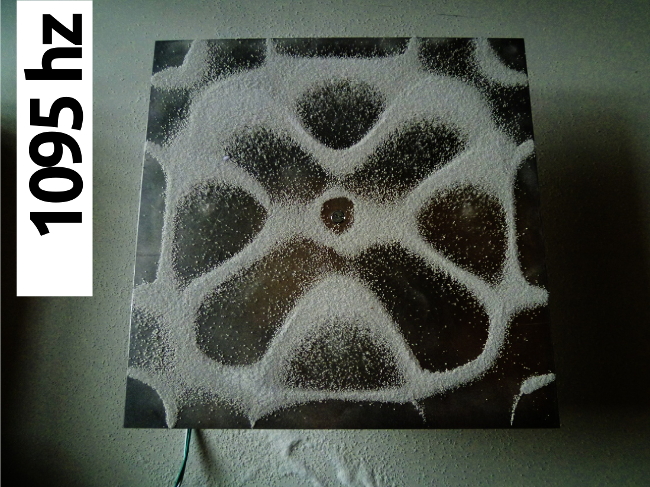
The experiment shows that, if fine dust, sand, steel wool, liquid or gels are placed on a metal sheet and a vibration acoustic wave is applied, the particles are arranged to form specific patterns. The different substances are concentrated in the nodal lines of the sound waves.Those points where there is no oscillation highlight the negative or reverse pattern of resonant vibrations of the plate. This is connected to a metal plate through a cymatic device, consisting of a guitar amplifier adapted 15W. It has placed a transducer to the audio output of the amplifier. The sheet amplifies the vibrations of the oscillator. The transducer is a vibrating device contained in a plastic rigid housing of 3 ''. This has the property to behave as a speaker without membrane. The vibration occurs inside the housing. In this experiment, the transducer is connected by screws to the metal plate, 200 x 200mm and 2mm thick. Consequently, the vibrations emitted by the transducer will vibrate the plate homogeneously. The device needs an external signal to the desired response occurs. Normally it is working with an analog oscillator, synthesizer or other sound source, through which pure frequencies can be played. In this case, the source comes from a programmed application with an application in the visual programming language Pure-data, which can be assigned by a scanning different frequencies in the audible range. Experimenting with this set, we found few singular points of frequencies, in which various figures and geometric patterns are formed. These unique frequencies are: 297hz, 517hz, 674hz, 912hz, 932hz, 1095hz, 1199hz, 1542hz, 1915hz, 2143hz, 2405hz, 2554hz, 2944hz, 4233hz, 7129hz, 7737hz, 8327hz, 8733hz, 8978hz, 9851hz (the lower and upper frequencies are no longer noticeable, due to acoustic transducer range).

+ info at sonomorphism wordpress blog
Audiyolab's blog section
image image image image image image image


Bea Goller

Bea Goller holds a Phd degree from ETSAM (School of Architecture Madrid 2015 ) and a MA in Architecture from ETSAB ( School of Architecture 1989). She and her husband Yago Conde founded an architectural Studio based in Barcelona, Spain in 1989. Their works include many designs and International competitions. After his death she has been the founder of Congoritme arqtes in 2003, incorporating research to her designs and combining the architectural praxis with lecturing and teaching.

2006/7 she has colaborated with the Studio RCR. From 2009 to 2014 she has been researching the crossing field of architecture and sound, getting a Phd with her thesis . ‘Sonic Spaces’

Espacios_Sonicos___BeaGoller__TesisETSAM.UPM_D2014.pdf Professor at :
Visiting professor at the GSFA University Pennsylvania in 1993
Ephemeral Architecture Master at ELISAVA Architectural Design School / UPF BCN [1991--2004] Mies Van der Rohe Masterclass, ETSAB/ UPC professor and lecturer at the Metropolis Program (CCCB/ UPC/Pompeu Fabra) [1991--2004] Lately she has been professor at two workshops at IaaC, Barcelona.

She has also been exhibition curator at COAC (Catalan association of architects) from 1988 to 1992 and an external colaborator of the magazine Quaderns d’Arquitectura. She has been co-author and edited the book ‘Kahn libraries = Kahn bibliotecas’, Barcelona, Col.Legi d’Arquitectes de Catalunya, GG,1989 and the book ‘Architecture of the inderterminacy’, by Yago Conde, Actar 2000.

Some of her work has been published at AAFiles, Quaderns d’Arquitectura, Techniques & Architecture, Pasajes, arquitectura y crítica, among others. Exhibits of her work were presented at the Col.legi d’ Arquitectes de Girona, at the Col.legi d’Arquitectes Tecnics de Barcelona, at Zoellner Arts Center, Lehigh University, at Galerie Philomene Magers and Galerie Max Hexler, Köln.
Sonic Spaces PhD Thesis
congoritme.net (former architectural designs)


Sonic Spaces Research Lab


Research Team

Bea Goller

Xavi Manzanares /// Coding & Tech devs


Tech Consultors
HANGAR Sonor // BEFACO // M.I.D. // IAAC // Fablabbcn


Partners
Congoritme // Ones Hàptiques // Noconventions // Nits Digitals


Networked researches

http://sonomorphism.wordpress.com
http://oneshaptiques.space